
In the fast-paced world of rail logistics, railcar outage tables play a vital role in ensuring operational efficiency. These tables provide detailed insights into railcar downtime, maintenance schedules, and repair performance — helping companies make data-driven decisions that directly impact profitability.
Whether you manage a railcar fleet or oversee transportation operations, understanding how to monitor, analyze, and reduce downtime using outage tables can transform your maintenance strategy and minimize costly disruptions.
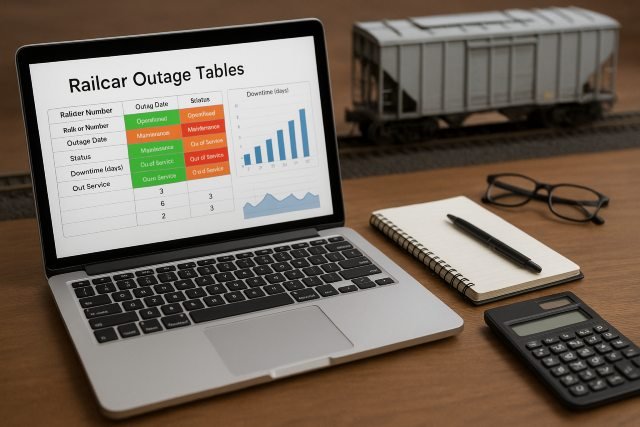
What Are Railcar Outage Tables?
Railcar outage tables are structured data reports that track the time a railcar spends out of service. These tables usually include:
- Railcar ID or number
- Type of outage (maintenance, inspection, repair, derailment, etc.)
- Start and end dates of the outage
- Location of the event
- Responsible department or vendor
- Reason codes and repair categories
Essentially, these tables act as a performance dashboard for your railcar fleet. They reveal trends, bottlenecks, and recurring issues that lead to unplanned downtime.
Why Monitoring Railcar Outage Tables Matters
1. Visibility Into Fleet Performance
Outage tables offer a clear, centralized view of all inactive cars. This visibility allows maintenance and operations teams to prioritize high-impact repairs and balance asset utilization effectively.
2. Cost Control and Budget Accuracy
By monitoring downtime duration and cause, you can identify costly recurring failures or inefficient repair processes. This helps in budget forecasting and vendor performance evaluation.
3. Compliance and Safety Assurance
Accurate railcar outage tracking ensures compliance with FRA (Federal Railroad Administration) regulations and other safety standards. Keeping detailed records also helps during audits and inspections.
Key Metrics to Track in Railcar Outage Tables
When analyzing your railcar outage tables, focus on these key performance indicators (KPIs):
| Metric | Description | Goal |
|---|---|---|
| Mean Time to Repair (MTTR) | Average time to complete a repair | Reduce by 10–20% yearly |
| Downtime Percentage | % of total fleet time lost to outages | Keep below 5% |
| Failure Frequency | Number of failures per 100 cars | Identify recurring issues |
| Repair Cost per Car | Total repair cost divided by cars serviced | Benchmark vendors |
| Outage Type Distribution | Ratio of scheduled vs unscheduled outages | Increase scheduled maintenance |
Tracking these data points helps determine where to optimize maintenance cycles and minimize unplanned downtime.
How to Analyze Railcar Outage Tables Effectively
1. Centralize Your Data
Use a fleet management software or rail analytics platform to consolidate data from multiple repair shops, vendors, and internal departments. Centralization allows real-time analysis and cross-functional insights.
2. Use Data Visualization Tools
Transform raw outage data into visual dashboards (charts, heatmaps, timelines). Visual tools like Power BI or Tableau make it easier to spot trends and forecast potential breakdowns.
3. Identify Root Causes
Categorize outage reasons (e.g., mechanical, structural, safety inspection, derailment) to uncover systemic problems. For instance, if 40% of outages are due to bearing issues, focus on preventive bearing maintenance.
4. Benchmark Performance
Compare your fleet’s performance against industry averages or historical data. This helps validate your progress and identify whether your downtime reduction strategies are effective.
Practical Steps to Reduce Railcar Downtime
Reducing downtime is not just about fixing problems faster — it’s about preventing them. Here’s how to leverage railcar outage tables for continuous improvement:
1. Implement Predictive Maintenance
Use outage data to train predictive models that forecast when a component might fail. This proactive approach minimizes unexpected repairs and extends asset lifespan.
2. Schedule Regular Preventive Checks
Regular inspections based on usage, not just calendar dates, ensure cars are serviced before breakdowns occur.
3. Improve Communication Between Teams
Integrate your maintenance, operations, and supply chain departments. Shared access to outage tables ensures everyone works from the same data and priorities.
4. Collaborate with Repair Vendors
Hold vendors accountable using performance metrics (turnaround time, quality score, repeat failure rate). Transparency encourages faster, higher-quality repairs.
5. Automate Reporting
Automating the generation of railcar outage tables saves time, reduces manual errors, and ensures consistent tracking across all facilities.
Common Challenges with Railcar Outage Data
While valuable, outage tables can also introduce challenges such as:
- Incomplete or inconsistent data entry
- Lack of integration between systems
- Difficulty in standardizing reason codes
- Overreliance on manual reporting
To overcome these, invest in data governance and automation tools that standardize inputs and improve data reliability.
Real-World Example: Downtime Reduction in a Rail Fleet
A North American rail operator analyzed its railcar outage tables and found that 25% of downtime came from repetitive brake issues. By implementing predictive analytics and retraining crews, the company reduced downtime by 18% within six months — saving nearly $1.2 million annually in lost service days.
This case shows how data-driven decision-making turns outage tracking into a competitive advantage.
Frequently Asked Questions (FAQ)
What is a railcar outage?
A railcar outage occurs when a car is temporarily removed from service for repairs, inspections, or other maintenance activities.
How often should outage tables be updated?
Ideally, daily — or at least weekly. Frequent updates keep your data accurate and actionable.
Can outage tables integrate with ERP or maintenance systems?
Yes. Modern fleet software integrates outage data with ERP, CMMS, and inventory systems for full visibility and automation.
How do outage tables help with regulatory compliance?
They maintain a clear record of maintenance history, supporting compliance with FRA and AAR (Association of American Railroads) standards.
Conclusion
Railcar outage tables are more than just maintenance logs — they are a strategic tool for boosting fleet uptime, cost efficiency, and safety compliance. By consistently monitoring, analyzing, and acting on outage data, operators can transform raw information into measurable operational gains.
Implementing the best practices above — from predictive maintenance to data automation — ensures your rail fleet runs smoother, safer, and smarter.


Leave a comment